Main findings: Local authority and children’s homes in England inspections and outcomes - autumn 2021
Published 25 November 2021
Applies to England

© Crown copyright 2021
This publication is licensed under the terms of the Open Government Licence v3.0 except where otherwise stated. To view this licence, visit or write to the Information Policy Team, The National Archives, Kew, London TW9 4DU, or email: psi@nationalarchives.gov.uk.
Where we have identified any third party copyright information you will need to obtain permission from the copyright holders concerned.
This publication is available at /government/statistics/local-authority-and-childrens-homes-in-england-inspections-and-outcomes-autumn-2021/main-findings-local-authority-and-childrens-homes-in-england-inspections-and-outcomes-autumn-2021
This is the main findings report for the local authority (LA) and children’s homes inspections and outcomes in England release. The following are also available:
- underlying data
- methodology
- pre-release access list
Summary
This release covers:
- inspections and outcomes for LA children’s services inspections as at 31 August 2021, published by 30 September 2021
- inspections and outcomes for LA children’s services inspections between 1 April 2021 and 31 August 2021, published by 30 September 2021
- the most recent inspections and outcomes for all children’s homes as at 31 August 2021, published by 30 September 2021
- inspections and outcomes for all children’s homes between 1 April 2021 and 31 August 2021, published by 30 September 2021
Between 1 April and 31 August 2021, around a third of LAs received some inspection activity.
In the 5-month period covered by this release, Ofsted carried out a total of 58 visits or inspections to LAs. A total of 54 LAs (36% of all LAs) received some inspection activity.
Around 4 in 5 children’s homes were judged good or outstanding.
As at 31 August 2021, the proportion of children’s homes judged good or outstanding was 79%. This is a decrease of 3 percentage points since the most recent comparable date of 31 August 2019.
Among the children’s homes that received their first ever inspection between 1 April and 31 August 2021, the majority were judged good or outstanding.
In total, 209 homes received their first ever full inspection in the period. Of these, 127 (61%) were judged good or outstanding, 50 (24%) requires improvement to be good and 32 (15%) inadequate.
Introduction
This release contains data on inspections and visits to LAs and children’s homes of all types. It supplements the children’s social care data in England 2021 statistics, which cover all Ofsted inspections of social care providers. We publish these on an annual basis in July.
Inspection details
We inspect the 152 LAs in England responsible for ensuring and overseeing the effective delivery of social care services for children.
We inspect LA services for children who need help and protection, children in care and care leavers under the inspections of local authority children’s services (ILACS) framework. This inspection cycle began in January 2018. The previous framework, the single inspection framework (SIF), ended in October 2017. It was, however, still used for some reinspections of inadequate LAs up until summer 2018. Throughout this release, when we refer to LAs improving or declining, we are comparing the current position under ILACS with the picture at the end of every LA’s first SIF inspection.
We inspect children’s homes under the social care common inspection framework (SCCIF) framework.
From 12 April 2021, we resumed routine inspection of children’s homes. This had been suspended since 17 March 2020, in response to the COVID-19 (coronavirus) pandemic. Although routine inspection was suspended throughout the 2020 to 2021 reporting year, we continued urgent inspection and regulation work. There is more information about the inspection activity during that period in our children’s social care data in England 2021 national statistics.
Because the visits that took place in the 2020 to 2021 reporting year did not result in overall effectiveness judgements, we do not have comparable data for the equivalent 5-month period in 2020. Therefore, throughout the children’s homes section of this release, we make comparisons with the 1 April to 31 August 2019 period.
Children’s homes are made up of 4 different sub-types of homes:
- children’s homes
- residential special schools registered as children’s homes
- secure children’s homes
- short-break-only homes
In this release, we report on the 4 types of children’s homes together.
Local authority children’s services
There are . The 152 local authorities in England provided children’s services to around . Around . We inspect these LAs to see how their children’s services are performing.
At the end of March 2021, the number of children in need was at its lowest point since 2013, while the number of children in care was at an all-time high.
LA overall effectiveness as at 31 August 2021
As at 31 August 2021, 148 out of 152 LAs had received an overall effectiveness judgement. The remaining 4 LAs (North Northamptonshire; West Northamptonshire; Bournemouth, Christchurch and Poole; and Dorset) are newly created and have not yet received a graded inspection. Of the 148 LAs with an overall effectiveness judgement, half (76 LAs, 51%) were judged good or outstanding. The remaining LAs were requires improvement to be good (53 LAs, 36%) or inadequate (19 LAs, 13%).
This judgement profile has changed very little since 31 March 2020, due to the suspension of routine inspections in response to the COVID-19 pandemic. Although monitoring and focused assurance visits were carried out during this period, these visits do not lead to an inspection judgement. They did not, therefore, have an impact on the judgement profile.
Routine ILACS (short and standard inspections and focused visits) restarted in May 2021. By 31 August 2021, we had completed and published 1 standard inspection, of Sunderland LA, which received an overall effectiveness judgement of outstanding. This was an improvement on its previous judgement of inadequate.
Although there has been minimal change in the judgement profile since March 2020, the current profile is a substantial improvement from the picture after every LA’s first SIF inspection. At that point, only 36% of LAs were judged good or outstanding.
Figure 1: Change in the overall effectiveness profile of LAs since their first SIF inspection
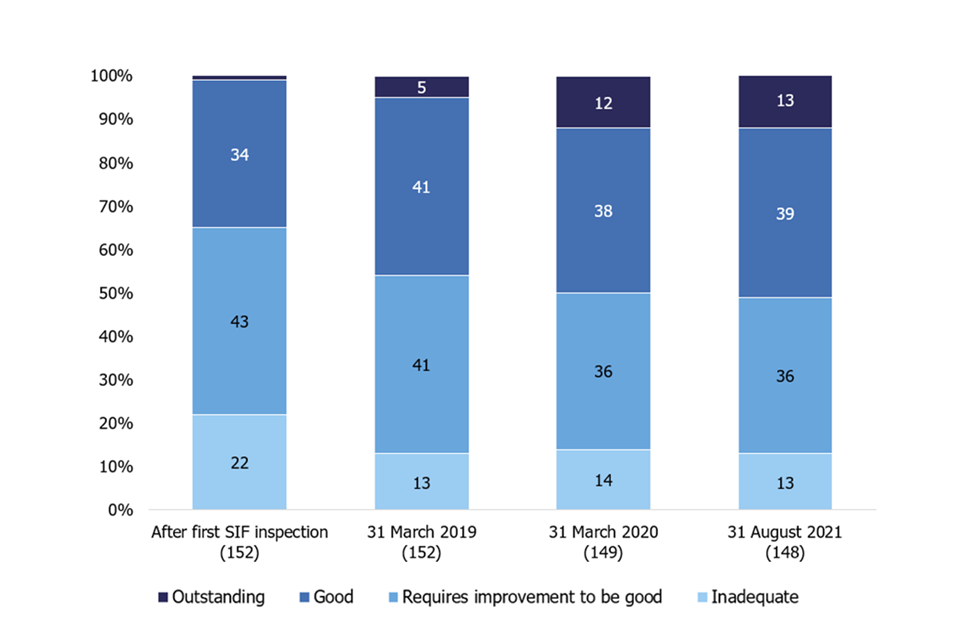
Numbers may not add up due to rounding.
View data in an accessible format.
ILACS activity between 1 April 2021 and 31 August 2021
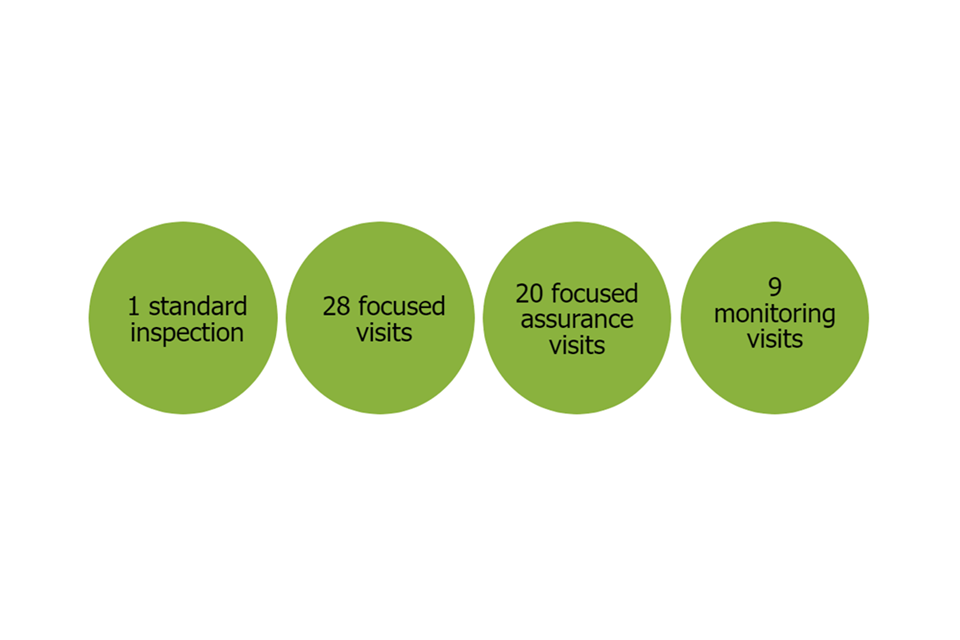
Between 1 April and 31 August 2021, 54 LAs (36% of all LAs) received some form of inspection activity, with a total of 58 inspections or visits being carried out. Four LAs received 2 visits each.
Figure 2: ILACS inspection activity between 1 April 2021 and 31 August 2021
View data in an accessible format.
Monitoring visits are typically carried out 3 or 4 times each year to LAs judged inadequate. In this period, 7 out of 9 LA monitoring visits were to LAs judged inadequate at their last graded inspection. The remaining 2 were to the new Northamptonshire LAs: North Northamptonshire and West Northamptonshire. We carried out monitoring visits to the new LAs because the single Northamptonshire LA was judged inadequate before it split into North and West.
We carried out focused assurance visits between September 2020 and May 2021, while graded inspections were suspended due to COVID-19. These visits were used to evaluate the extent to which children were well cared for and safe, and leaders and managers were exercising strong leadership. We prioritised LAs for focused assurance visits based on the most recent inspection judgements and the length of time since the last inspection. Of the 20 focused assurance visits carried out between 1 April and 31 August 2021, 11 were to LAs judged inadequate at their last graded inspection. Focused visits are for inspectors to evaluate an aspect of service, a theme, or the experiences of a cohort of children. Among the 28 focused visits that occurred between 1 April 2021 and 31 August 2021, almost half (13) were focused on children in need or subject to a protection plan. The LAs that received focused visits during this period had been judged to be outstanding (2), good (13) or requires improvement to be good (13) at their last graded inspection.
All children’s homes
During the period between 1 April 2021 and 31 August 2021, there was a net increase of 69 homes (3% increase) from 2,707 to 2,776. This was a result of 120 new registrations and 51 voluntary resignations.
Both the private and voluntary sectors saw a net increase in the number of homes. There was an increase of 71 homes (3% increase) in the private sector, and of 4 homes (3% increase) in the voluntary sector.
In contrast, there was a small net decrease in LA-run homes, with 6 new registrations and 12 deregistrations in the period. This includes 1 deregistered home that was run by an organisation that provides the children’s services function of the LA, such as a trust.
Inspection profile of all children’s homes as at 31 August 2021
Out of 2,776 active children’s homes as at 31 August 2021, 2,381 (86%) had an inspection judgement. The percentage is slightly higher than at the last reporting period of 31 March 2021, when 82% (2,217) of active children’s homes of all types had an inspection judgement.
From 12 April 2021, we resumed the routine inspection of children’s homes, which had been suspended since 17 March 2020 in response to the COVID-19 pandemic. This means that some of the new children’s homes that registered since the start of the pandemic have now received a graded full inspection.
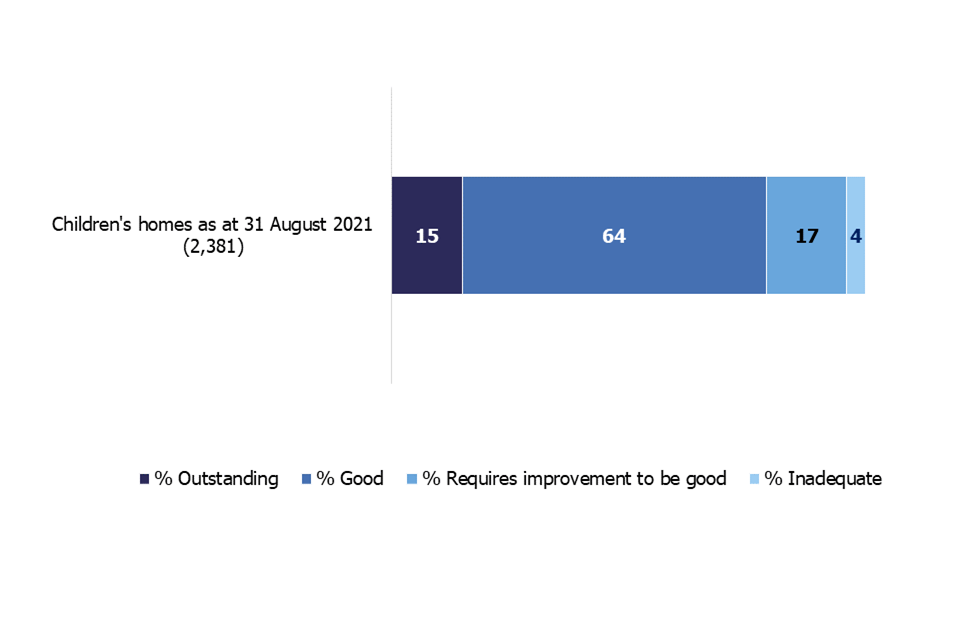
Of the 2,381 homes that had received an inspection outcome by 31 August 2021, 79% of homes were judged good or outstanding, 17% were judged requires improvement to be good and 4% were judged inadequate at their most recent inspection (see Figure 3).
Figure 3: Overall effectiveness of all children’s homes as at 31 August 2021
View data in an accessible format.
This judgement profile has changed slightly from the most recent comparable date (31 August 2019), when 82% were judged good or outstanding, 15% were judged requires improvement to be good and 3% were judged inadequate.
Table 1: Inspection outcomes for all children’s homes inspected as at 31 August 2021 and as at 31 August 2019
| Children’s homes as at 31 August 2021 (2,381) | Children’s homes as at 31 August 2019 (2,216) | |
|---|---|---|
| Outstanding | 357 | 401 |
| Good | 1,528 | 1,423 |
| Requires improvement to be good | 403 | 327 |
| Inadequate | 93 | 65 |
Regional profile of children’s homes as at 31 August 2021
Overall, the percentage of children’s homes of all types judged good or outstanding has fallen from 82% as at 31 August 2019 to 79% as at 31 August 2021. The London region, however, saw an increase in the proportion of homes judged good or outstanding of 7 percentage points. This increase was because most (19 out of 26) of the new children’s homes in London that were inspected between April and August 2021 were judged good at their first full inspection.
In 4 regions (North West; North East, Yorkshire and the Humber; South West; and East of England), the proportion of homes judged good or outstanding decreased by 5 percentage points or more. Because of these changes, the gap between the regions with the highest and the lowest percentage of children’s homes judged good or outstanding widened from 20 percentage points as at 31 August 2019 to 26 percentage points as at 31 August 2021 – the biggest gap since 2017.
Table 2: Proportion of children’s homes of all types judged good or outstanding as at 31 August 2021 and as at 31 August 2019 by Ofsted region
| Number of children’s homes inspected as at 31 August 2021 | Percentage of children’s homes judged good or outstanding as at 31 August 2021 | Number of children’s homes inspected as at 31 August 2019 | Percentage of children’s homes judged good or outstanding as at 31 August 2019 | |
|---|---|---|---|---|
| England | 2,381 | 79 | 2,216 | 82 |
| East Midlands | 257 | 82 | 223 | 81 |
| East of England | 187 | 78 | 172 | 83 |
| London | 119 | 80 | 109 | 72 |
| North East, Yorkshire and the Humber | 365 | 81 | 340 | 88 |
| North West | 581 | 77 | 544 | 85 |
| South East | 293 | 90 | 284 | 87 |
| South West | 173 | 64 | 169 | 69 |
| West Midlands | 406 | 78 | 375 | 80 |
Percentages are rounded.
Overall effectiveness of children’s homes by sector as at 31 August 2021
Overall, children’s homes run by the voluntary sector performed better than those in the LA sector and privately owned homes. However, the dataset is small and conclusions should be treated with caution. As at 31 August 2021, 85% of voluntary-run homes were judged good or outstanding, compared with 77% of homes in the LA sector and 79% of homes in the private sector (see Figure 4).
Although LAs had the lowest proportion of children’s homes judged good or outstanding, they had the highest proportion of outstanding children’s homes (22%). However, they also had a slightly higher proportion of inadequate homes (6%).
The private sector had the lowest proportion of homes judged outstanding (13%) as at 31 August 2021.
Figure 4: Overall effectiveness of all children’s homes as at 31 August 2021 by sector
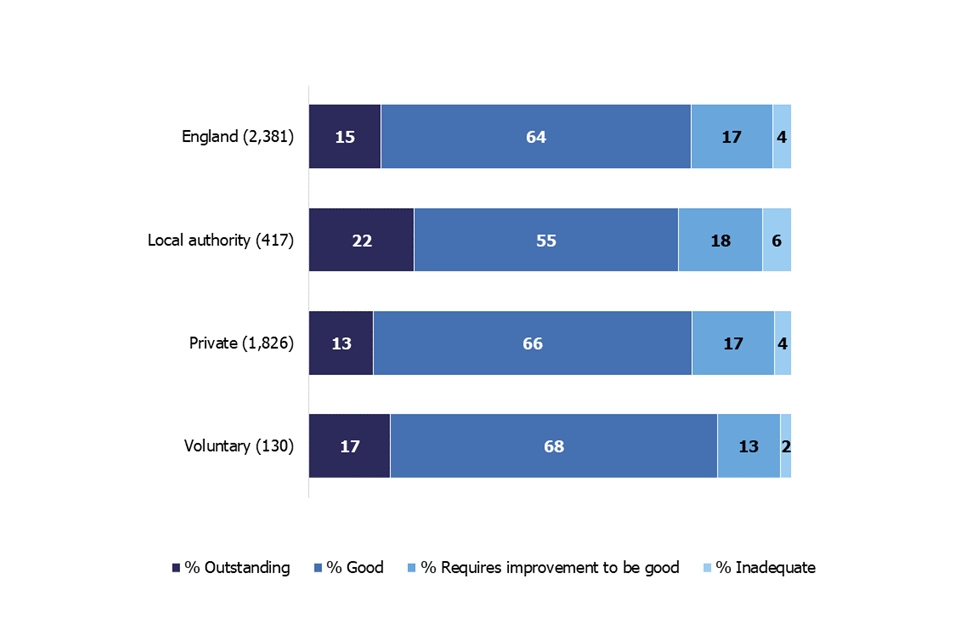
Percentages are rounded and may not add to 100.
We have not included inspection judgements for health authority homes as a separate entry as there are so few of them (8 homes; 7 judged good and 1 requires improvement to be good). However, we have included these in the England figure.
The number of homes in the LA sector includes 20 children’s homes that are managed by organisations that run children’s services independently of the LA. These 20 homes are recorded in the underlying data as belonging to the voluntary sector.
View data in an accessible format.
All children’s homes inspections in the period between 1 April and 31 August 2021
Between 1 April and 31 August 2021, there were a total of 1,215 inspections or visits to 1,058 children’s homes of all types. This is a 13% increase in activity on the previous comparable 5-month period (1 April to 31 August 2019), when there were 1,078 inspections or visits to 937 homes. Although the number of inspections was higher during the 5-month period in 2021, so was the number of active homes. This meant that a slightly smaller proportion of the homes active on 31 March 2021 received an inspection by 31 August (39%), compared with in 2019 (41%).
Of the 1,215 inspections and visits in this period, 1,041 were full inspections of 1,012 children’s homes of all types. Twenty-nine homes had a second full inspection in this period, following an inadequate judgement at the first inspection. The remaining activity during this reporting period was 170 monitoring visits and 4 interim inspections. The following section reports on the outcomes of full inspections only. See the ‘Monitoring visits’ and ‘Interim inspections’ sections for further discussion on these.
During this reporting period, 67% of all children’s homes inspections (702 inspections) resulted in a good or outstanding judgement, and 11% (117 inspections) in an inadequate judgement. We discuss homes judged inadequate in the ‘Inadequate inspections in the period’ section.
Figure 5: Overall effectiveness outcomes from inspections of all types of children’s homes that took place between 1 April 2021 and 31 August 2021
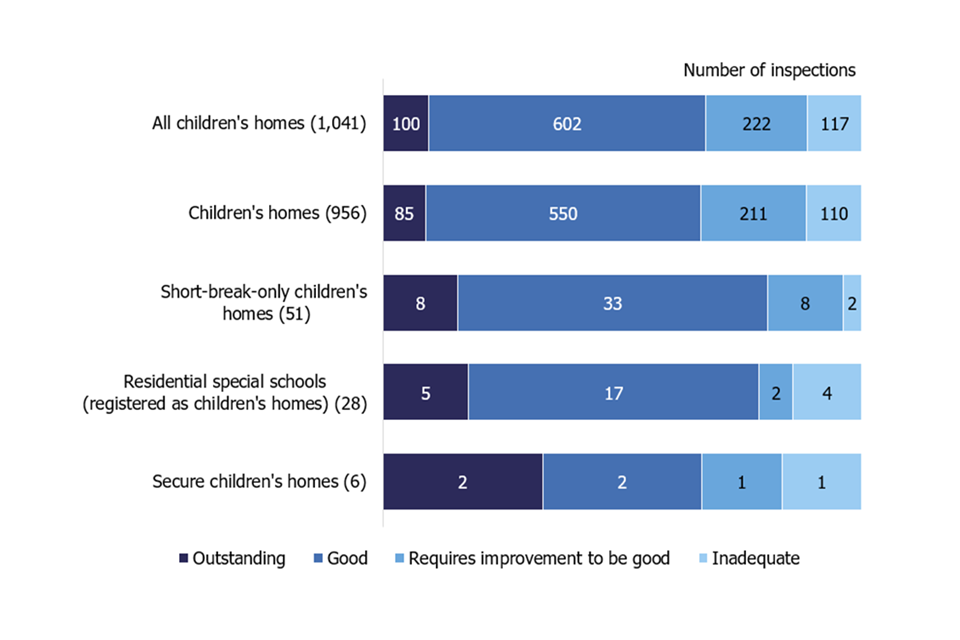
Numbers in brackets refer to the number of inspections that occurred at each setting type between 1 April 2021 and 31 August 2021.
View data in an accessible format.
Previous inspection activity of children’s homes inspected between 1 April and 31 August 2021
Although all full inspections of social care providers were suspended in March 2020, between 1 April 2020 and 31 March 2021 we continued with monitoring visits and started carrying out assurance visits to ensure that children were safeguarded. These assurance and monitoring visits did not result in graded judgements.
Of the 1,012 homes that had a full inspection between 1 April 2021 and 31 August 2021, 538 (53%) also received some inspection activity in the form of a monitoring and/or assurance visit during 2020 to 2021.
This is similar to the proportion of homes that had not had a full inspection in the first 5 months of 2021 to 2022 and received a monitoring or an assurance visit in the previous year. Of the 1,775 active children’s homes as at 31 August 2021, 967 (54%) received at least 1 monitoring or assurance visit during 2020 to 2021.
Overall effectiveness for all children’s homes – change since the previous inspection judgement
Of the 1,012 children’s homes that received a full inspection between April and August 2021, 803 homes had a previous inspection judgement, and 209 were new homes that had not been inspected yet.
Of these 209 new homes, the majority (127, 61%) were judged either good or outstanding; 50 (24%) homes were judged requires improvement to be good; and 32 (15%) homes received an inadequate judgement.
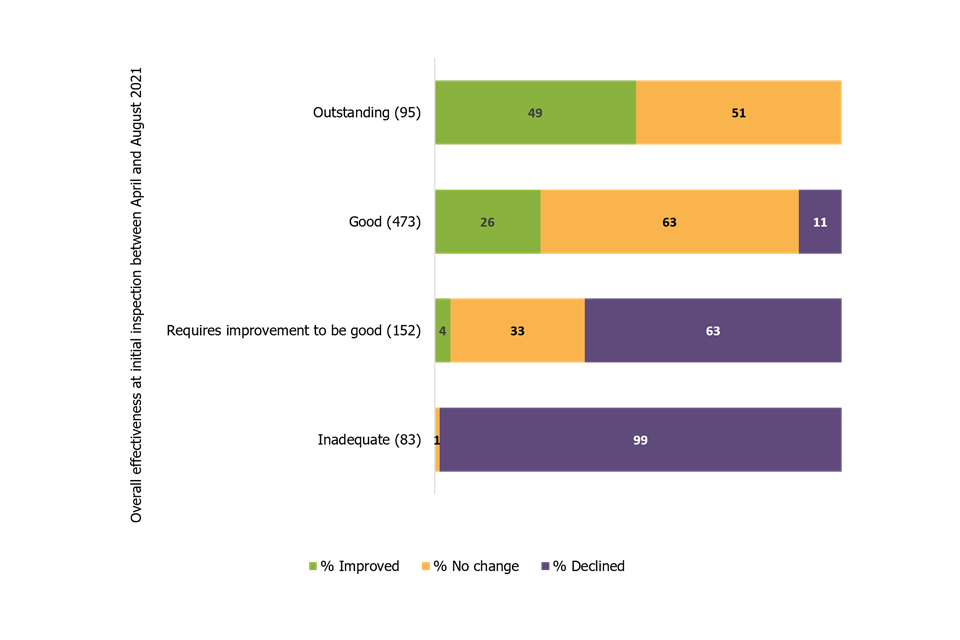
Of the 803 homes that had a previous inspection grade, half retained the same judgement. Of the remaining homes, 22% improved and 28% declined compared with their previous judgement.
Figure 6: Change in the overall effectiveness for the children’s homes inspected between 1 April 2021 and 31 August 2021 compared with their previous inspection grade
View data in an accessible format.
Inadequate inspections in the period
We prioritise inspections based on a provider’s previous inspection judgement and any concerns we have about them. As a result of this selection process, we anticipated that in the early part of the inspection year we would see some homes decline. The data confirmed what we anticipated, with 11% (115 of 1,012) of all children’s homes inspected between 1 April and 31 August 2021 receiving a judgement of inadequate. This is a slightly higher proportion than in the previous comparable reporting period: 9% between 1 April 2019 and 31 August 2019.
For just over a quarter of the 115 homes that were judged inadequate (32, 28%), this was their first ever inspection judgement. Of these 32 homes, 19 had received at least 1 monitoring or assurance visit between April 2020 and March 2021. We carried out other regulatory or monitoring activity to most of the remaining 13 homes. This activity resulted in the suspension of 5 providers, and 1 restriction of accommodation.
The reasons that these 32 homes were judged inadequate at their first inspection were similar to those for all other inadequate homes. The existing challenges faced by all children’s homes appear to have been more difficult for newer homes to overcome.
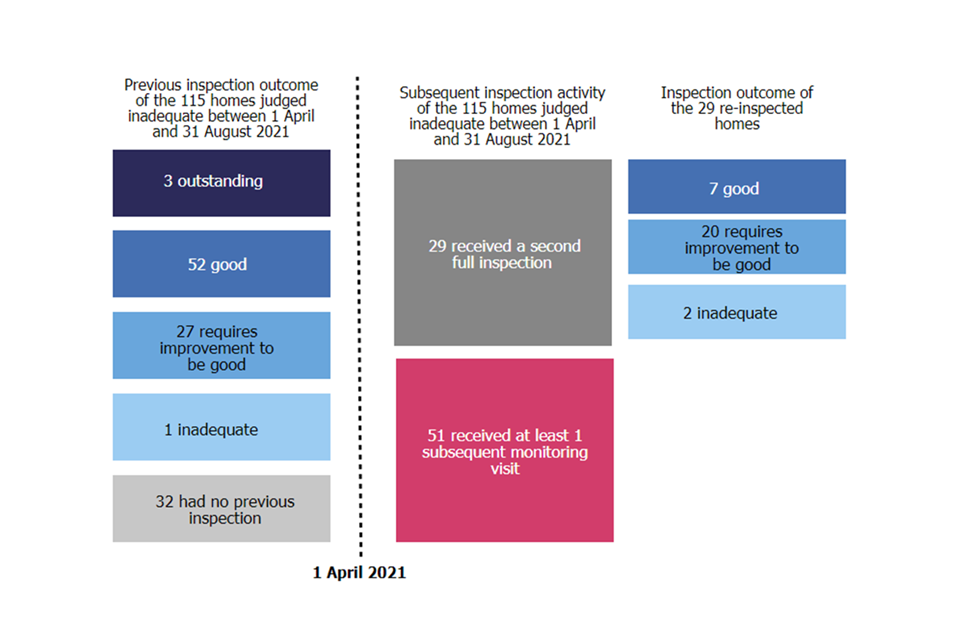
The remaining 83 homes that were judged inadequate in this reporting period had a previous inspection judgement. Out of these 83, only 1 had been inadequate at its previous inspection. Three declined from outstanding, 52 from good and 27 from requires improvement to be good. Between April 2020 and March 2021, while routine inspection was paused, most of these homes had received at least 1 monitoring or assurance visit. These visits provided oversight of what was happening for children.
There were 68 homes that received an inadequate judgement after 1 April 2021 and went on to receive a subsequent inspection or monitoring visit by 31 August 2021. Of those that received a full inspection, the majority (27 out of 29) improved their grade. For those homes that were inspected and judged inadequate near the end of the 5-month period covered by this release, there may not have been sufficient time for another visit or inspection within the reporting period.
As at 31 August 2021, 9 of the 115 homes judged to be inadequate within the reporting period had resigned, and 8 were suspended. As a result of this activity, and the improvement in some home’s grades, 80 of the initial 115 homes remained inadequate on 31 August 2021.
Figure 7: Previous inspection judgements and subsequent inspection activity for homes judged inadequate between 1 April and 31 August 2021
View data in an accessible format.
Regional breakdown of homes with an inadequate judgement
Among the homes that were inspected between 1 April and 31 August 2021, the proportion of homes that received an inadequate judgement differed between the regions. The highest proportion was in the North West region, where 19% of the inspected homes were judged inadequate (36 out of 191 homes).
Table 3: Number and proportion of homes judged inadequate between 1 April and 31 August 2021, by region
| Number of homes inspected between 1 April and 31 August 2021 | Number of homes judged inadequate between 1 April and 31 August 2021 | Proportion of homes judged inadequate between 1 April and 31 August 2021 | |
|---|---|---|---|
| England | 1,012 | 115 | 11% |
| East Midlands | 122 | 9 | 7% |
| East of England | 104 | 3 | 3% |
| London | 53 | 6 | 11% |
| North East, Yorkshire and the Humber | 137 | 18 | 13% |
| North West | 191 | 36 | 19% |
| South East | 128 | 9 | 7% |
| South West | 91 | 10 | 11% |
| West Midlands | 186 | 24 | 13% |
Sector breakdown of homes with an inadequate judgement
The proportion of homes that received an inadequate judgement also differed by sector. Among LA-run homes, 13% of those inspected between 1 April and 31 August 2021 were judged inadequate (22 out of 164 homes). This was a higher proportion than among homes in the private (11%) and voluntary sectors (7%).
Table 4: Number and proportion of homes judged inadequate between 1 April and 31 August 2021, by sector
| Number of homes inspected between 1 April and 31 August 2021 | Number of homes judged inadequate between 1 April and 31 August 2021 | Proportion of homes judged inadequate between 1 April and 31 August 2021 | |
|---|---|---|---|
| England | 1,012 | 115 | 11% |
| Local authority | 164 | 22 | 13% |
| Private | 777 | 88 | 11% |
| Voluntary | 67 | 5 | 7% |
| Health authority | 4 | 0 | N/a |
Regulatory activity between 1 April 2021 and 31 August 2021
Between 1 April 2021 and 31 August 2021, we issued a notice of suspension to 33 children’s homes. This is over a third more than in the similar period in the past 2 years (20 homes in April to August 2020 and 19 homes in April to August 2019).
Of these 33 children’s homes, 30 were inspected between April and August 2021. Of these 30 homes, 4 resigned, 12 were active and 14 were still suspended as at 31 August 2021. Of those that were still suspended, 8 homes received a full inspection (judged inadequate) and, of these, 5 also received at least 1 monitoring visit. The remaining 6 homes received at least 2 monitoring visits between April and August 2021.
Interim inspections
There were 4 interim inspections between 1 April 2021 and 31 August 2021. All 4 were to secure children’s homes and resulted in ‘sustained effectiveness’ judgements. One of the homes also had a monitoring visit in the same period. All 4 homes were previously judged either good or outstanding during April 2019 to March 2020.
Monitoring visits
Between 1 April and 31 August 2021, there were 170 monitoring visits to 118 children’s homes. This is broadly in line with the period between April and August 2019, when there were 152 monitoring visits to 113 homes.
For 42 children’s homes, a monitoring visit was the only inspection activity in the period between April and August 2021. These 42 homes had 71 monitoring visits in total, with 20 homes having 2 or more visits.
Of the 42 homes that only received a monitoring visit between April and August 2021, 6 were new homes that we had not previously inspected. Of the remaining 36 homes, 1 was previously judged outstanding, 28 good, 5 requires improvement to be good, and 2 inadequate.
For 64 children’s homes inspected in the period, a monitoring visit followed a full inspection in the same period. Most commonly, this full inspection resulted in a judgement of inadequate (51 homes), followed by requires improvement to be good (11 homes), good (1 home), and outstanding (1 home).
The remaining 12 homes that had a monitoring visit in the period had at least 1 monitoring visit that was then followed by a full or an interim inspection.
Revisions to previous release
The provisional data in the previous children’s social care data in England 2021 release related to the inspection activity (monitoring and assurance visits) that took place between 1 April 2020 and 31 March 2021 and that was published by 30 April 2021. It indicated that there were 2,237 visits to all social care providers in this period.
The revised data in this release shows that an additional 30 visits took place between 1 April 2020 and 31 March 2021, with the reports published since 30 April 2021. These consist of an additional 29 monitoring visits to 27 children’s homes and 2 residential family centres, and 1 assurance visit to an independent fostering agency.
Because the monitoring and assurance visits did not receive overall effectiveness judgements, these newly published reports did not change the overall effectiveness judgement profile of these providers.
These findings have not resulted in any changes to the main findings of the children’s social care data in England 2021 release.
We publish revisions to data in this publication in line with Ofsted’s revisions policy for official statistics.
Further information
Notes
There are 152 LAs in England. However, the analysis of LA inspections in this release is based on the outcomes for 148 LAs. This is due to a recent creation of 4 new LAs that have not yet received a graded inspection. From April 2021, Northamptonshire LA was split into 2 separate LAs: North Northamptonshire and West Northamptonshire. Additionally, from April 2019, Bournemouth, Christchurch and Poole exists as a single LA, and Dorset had a change of boundaries following the removal of Christchurch.
There is a methodology and quality report to accompany this release.
Due to rounding, percentages in this release may not add up to 100.
Contacts
If you are a member of the public and have any comments or feedback on this publication, contact Adam King (adam.king@ofsted.gov.uk) or the social care team (socialcaredata@ofsted.gov.uk).
Acknowledgements
Thanks to the following for their contribution to this statistical release: Jenny Bird and Anna Otczyk.
Glossary
Definitions of terms are in the statistical glossary.
Annex: data tables for figures
This section contains the underlying data in an accessible table format for all figures.
Data for Figure 1: Change in the overall effectiveness profile of LAs since their first SIF inspection (percentage)
| Overall effectiveness of LAs | After first SIF inspection | 31 March 2019 (152) | 31 March 2020 (149) | 31 August 2021 (148) |
|---|---|---|---|---|
| Outstanding | 1 | 5 | 12 | 13 |
| Good | 34 | 41 | 38 | 39 |
| Requires improvement to be good | 43 | 41 | 36 | 36 |
| Inadequate | 22 | 13 | 14 | 13 |
See Figure 1.
Data for Figure 2: ILACS inspection activity between 1 April 2021 and 31 August 2021
| Type of inspection activity | Number of inspections or visits |
|---|---|
| Standard inspection | 1 |
| Focused visits | 28 |
| Focused assurance visits | 20 |
| Monitoring visits | 9 |
See Figure 2.
Data for Figure 3: Overall effectiveness of all children’s homes as at 31 August 2021 (percentage)
| Overall effectiveness | % children’s homes as at 31 August 2021 (2,381 homes) |
|---|---|
| Outstanding | 15 |
| Good | 64 |
| Requires improvement to be good | 17 |
| Inadequate | 4 |
See Figure 3.
Data for Figure 4: Overall effectiveness of all children’s homes as at 31 August 2021 by sector (percentage)
| Overall effectiveness of children’s homes | England (2,381) | Local authority (417) | Private (1,826) | Voluntary (130) |
|---|---|---|---|---|
| Outstanding | 15 | 22 | 13 | 17 |
| Good | 64 | 55 | 66 | 68 |
| Requires improvement to be good | 17 | 18 | 17 | 13 |
| Inadequate | 4 | 6 | 4 | 2 |
See Figure 4.
Data for Figure 5: Overall effectiveness outcomes from inspections of all types of children’s homes, that took place between 1 April 2021 and 31 August 2021
| Outstanding | Good | Requires improvement to be good | Inadequate | |
|---|---|---|---|---|
| All children’s homes (1,041) | 100 | 602 | 222 | 117 |
| Children’s homes (956) | 85 | 550 | 211 | 110 |
| Short-break-only children’s homes (51) | 8 | 33 | 8 | 2 |
| Residential special schools (registered as children’s homes) (28) | 5 | 17 | 2 | 4 |
| Secure children’s homes (6) | 2 | 2 | 1 | 1 |
See Figure 5.
Data for Figure 6: Change in the overall effectiveness for the children’s homes inspected between 1 April 2021 and 31 August 2021 compared with their previous inspection grade
| Overall effectiveness at first inspection between April and August 2021 | Improved from their previous inspection grade | No change from their previous inspection grade | Declined from their previous inspection grade |
|---|---|---|---|
| Outstanding (95) | 49% | 51% | �� |
| Good (473) | 26% | 63% | 11% |
| Requires improvement to be good (152) | 4% | 33% | 63% |
| Inadequate (83) | �� | 1% | 99% |
See Figure 6.
Data for Figure 7: Previous inspection judgements and subsequent inspection activity for homes judged inadequate between 1 April and 31 August 2021
| Outstanding | Good | Requires improvement to be good | Inadequate | Had no previous inspection | Received a second full inspection | Received at least 1 monitoring visit | |
|---|---|---|---|---|---|---|---|
| Previous inspection outcome of the 115 homes judged inadequate between 1 April and 31 August 2021 | 3 | 52 | 27 | 1 | 32 | N/a | N/a |
| Subsequent inspection activity of the 115 homes judged inadequate between 1 April and 21 August 2021 | N/a | N/a | N/a | N/a | N/a | 29 | 51 |
| Inspection outcome of the 29 reinspected homes | N/a | 7 | 20 | 2 | N/a | N/a | N/a |
See Figure 7.